Supply-chain data, readable at a glance
Analytics screens for a platform that helps the foodservice industry run efficient supply chains, improve sourcing programs and raise food quality with data.
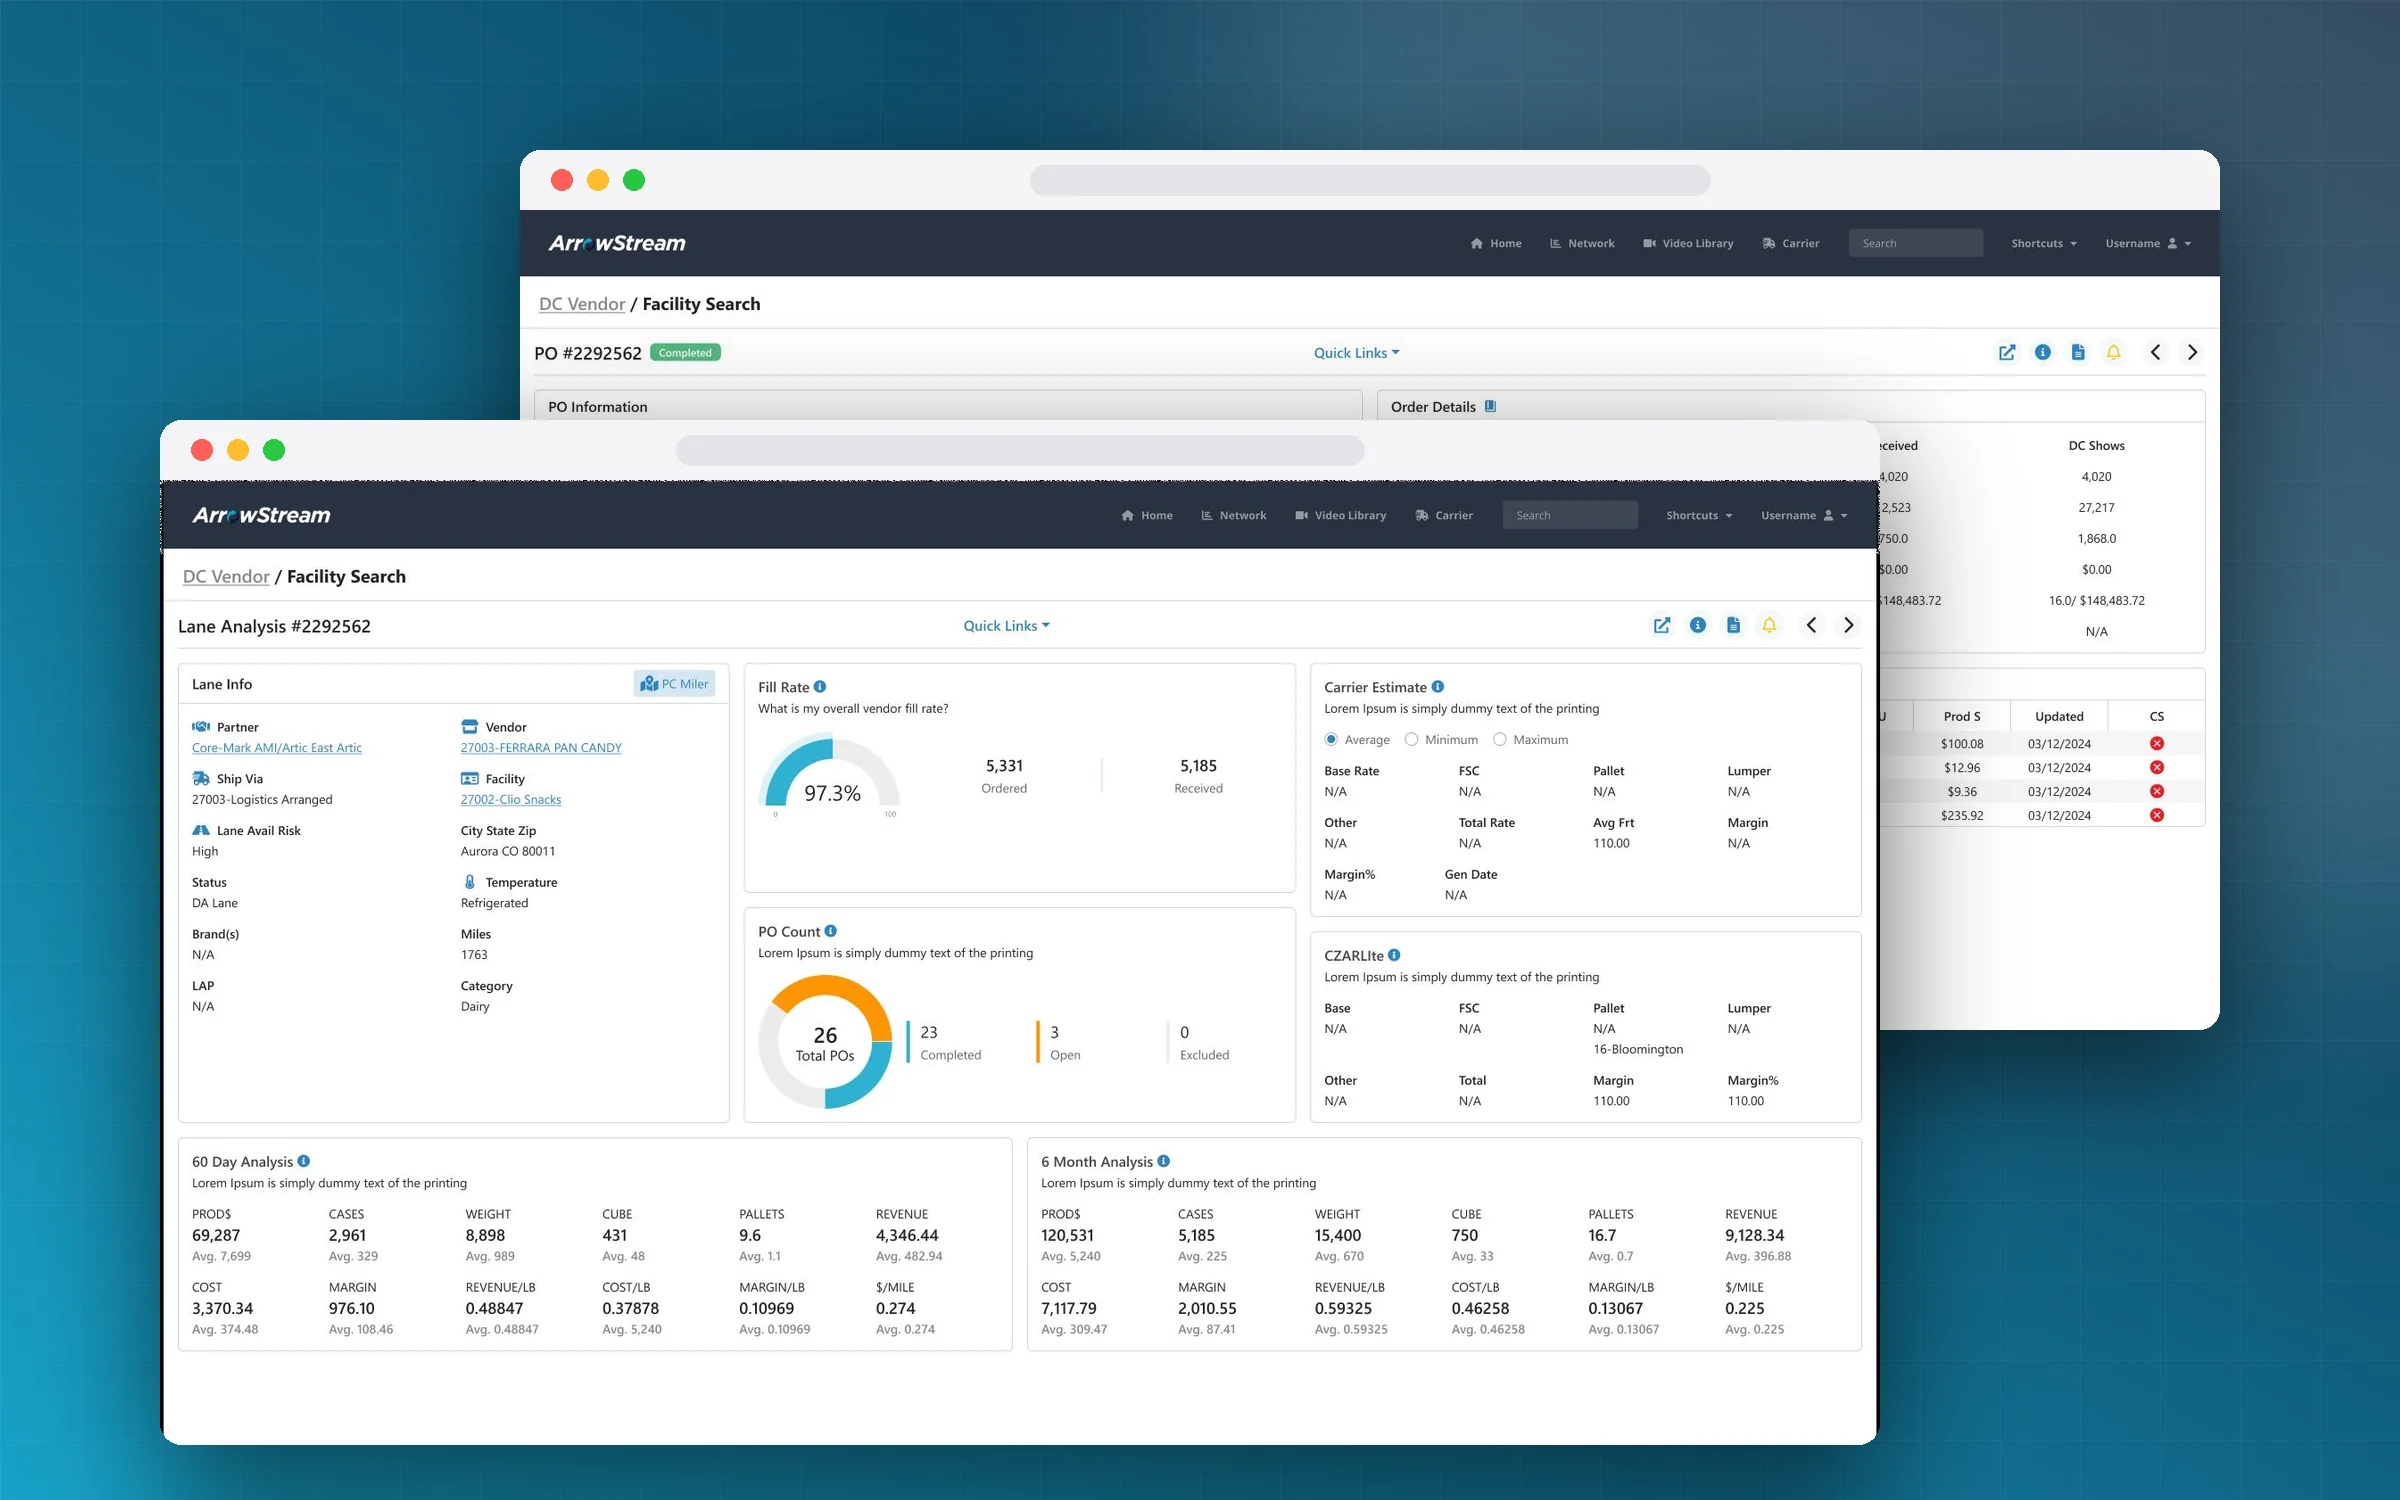
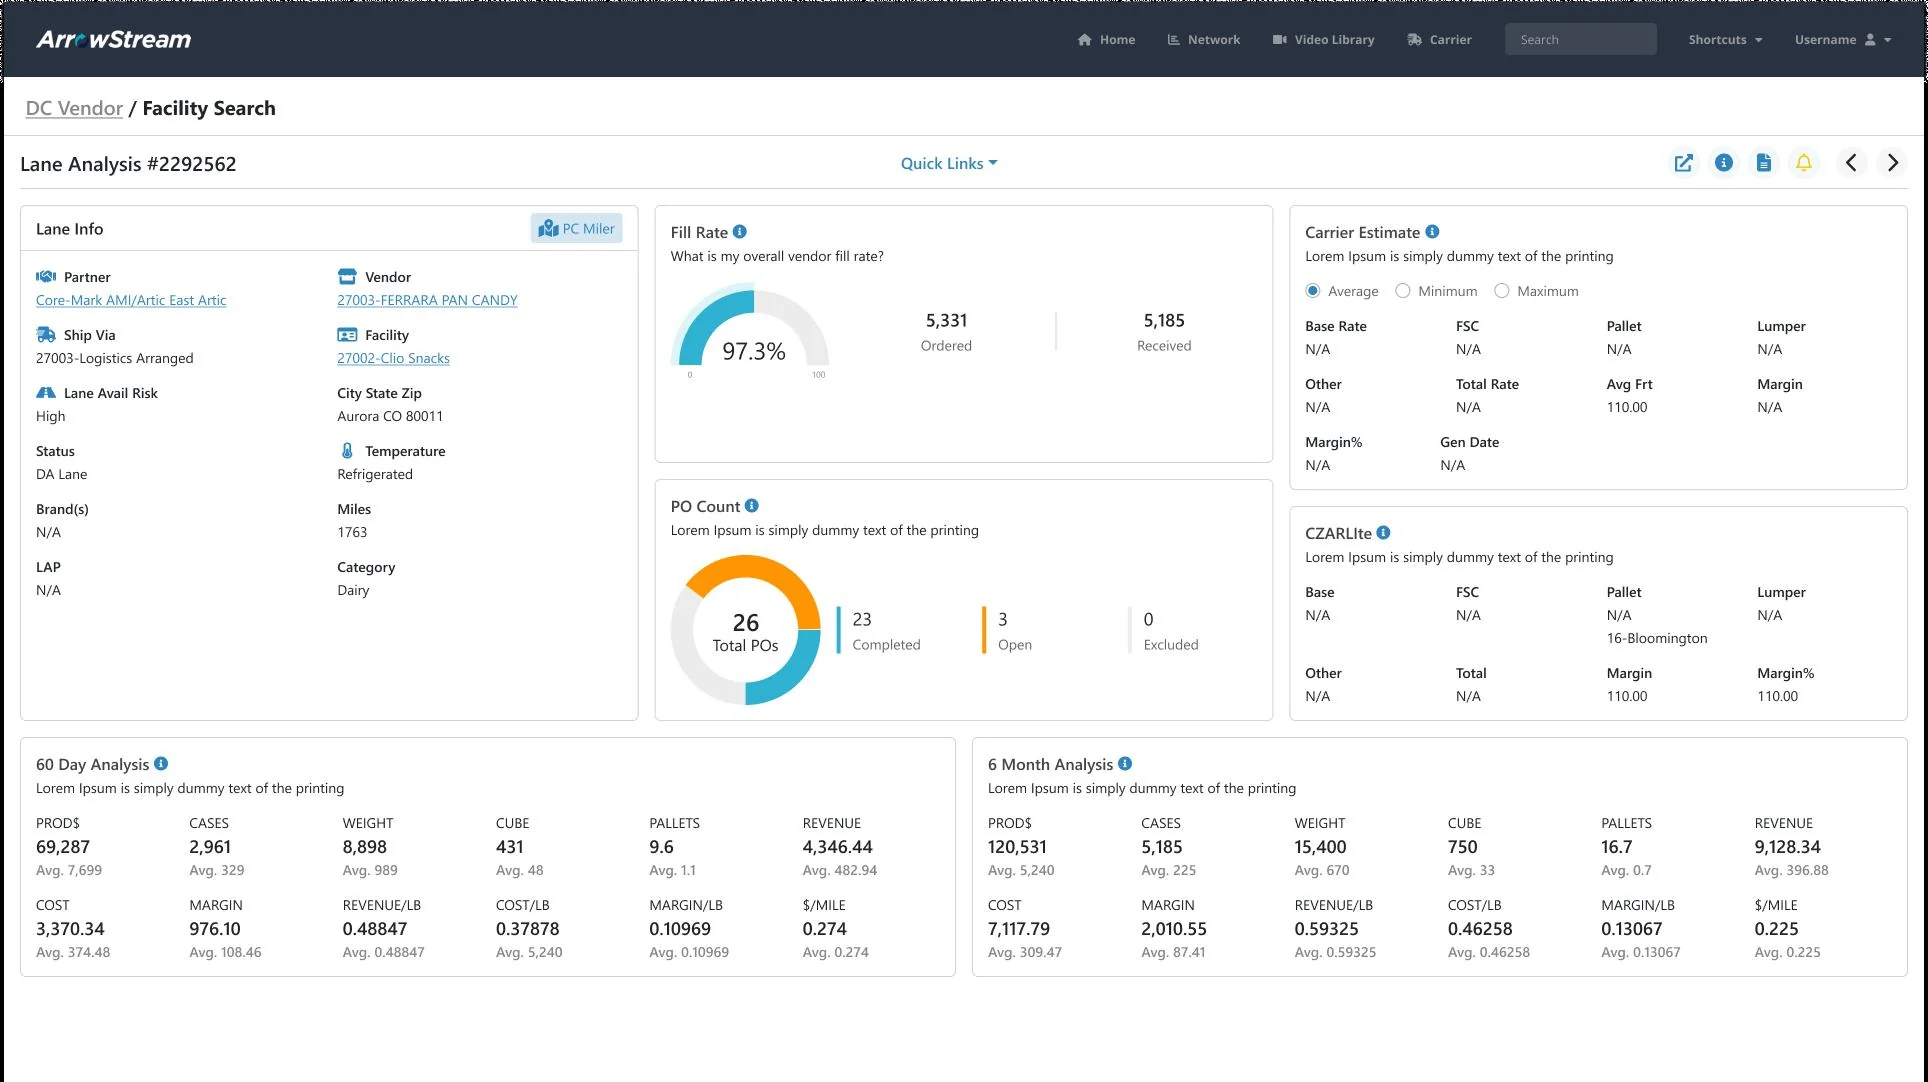
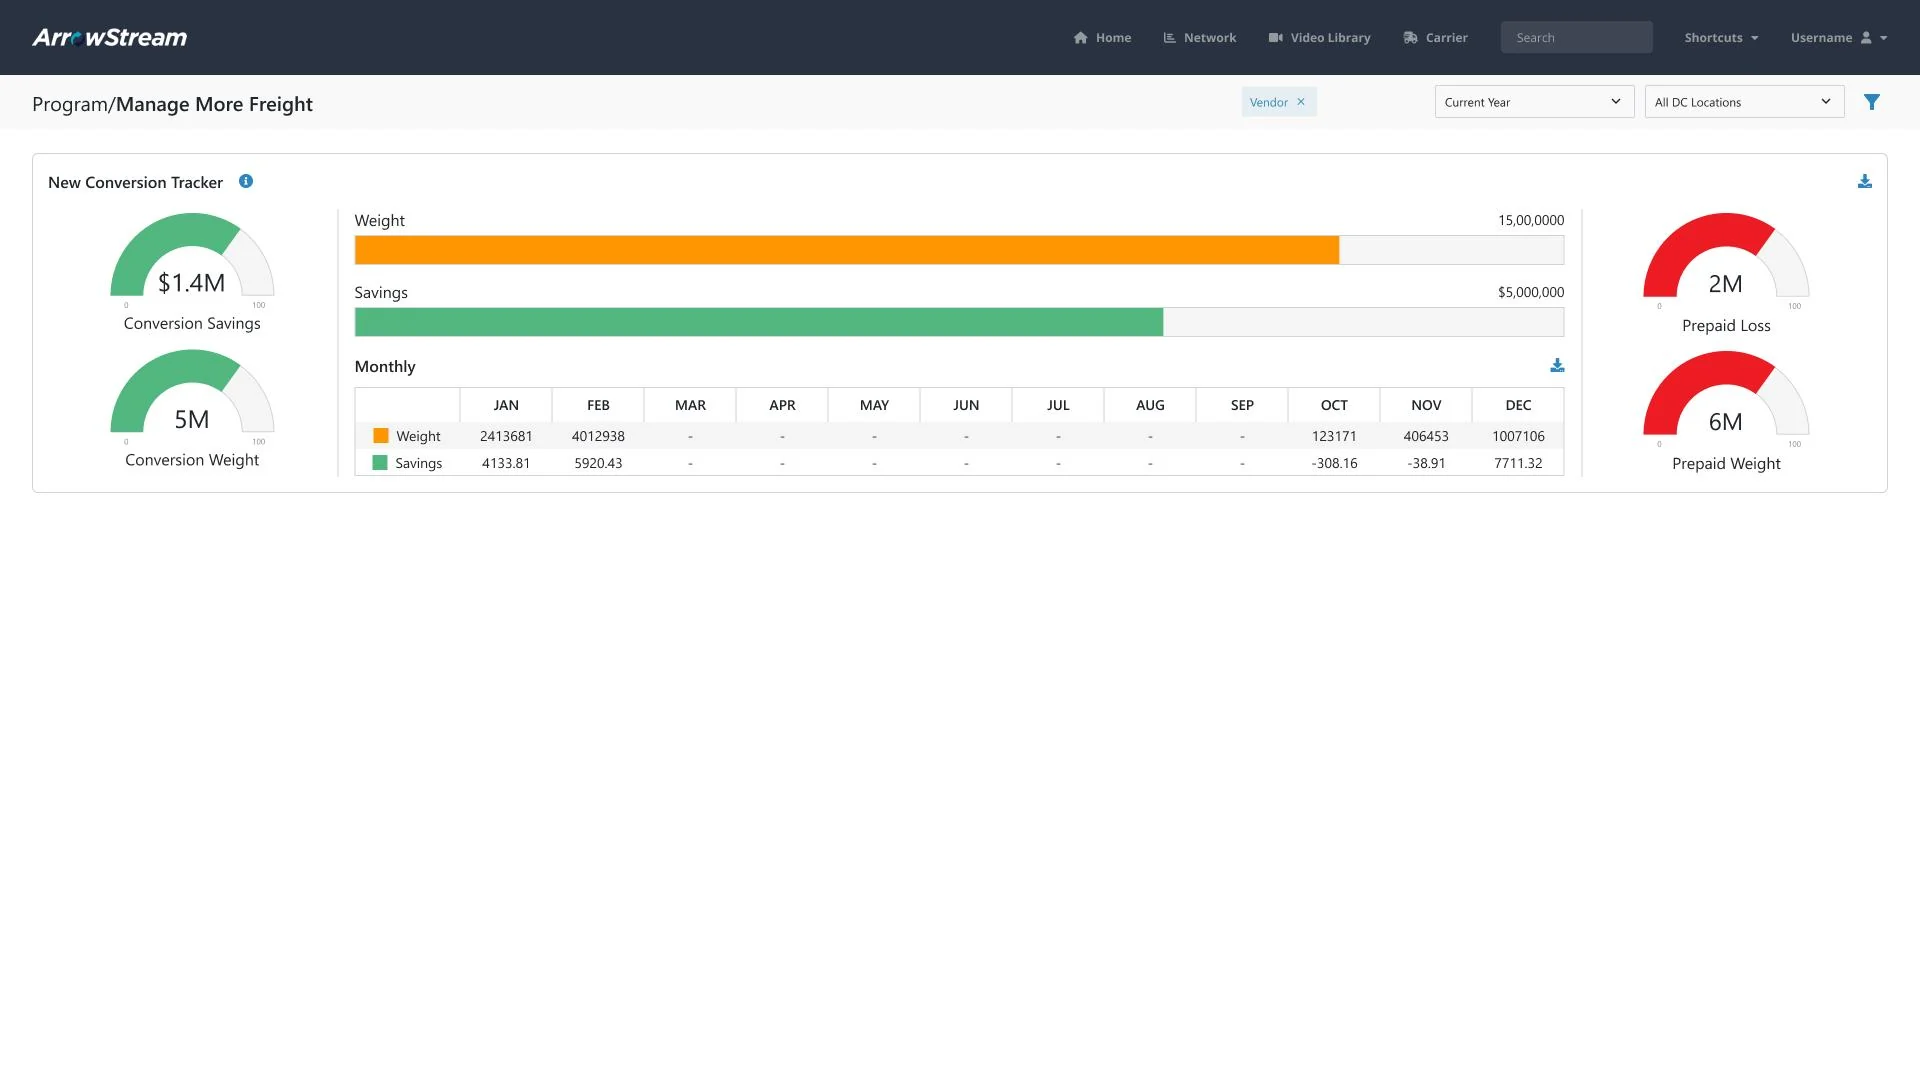
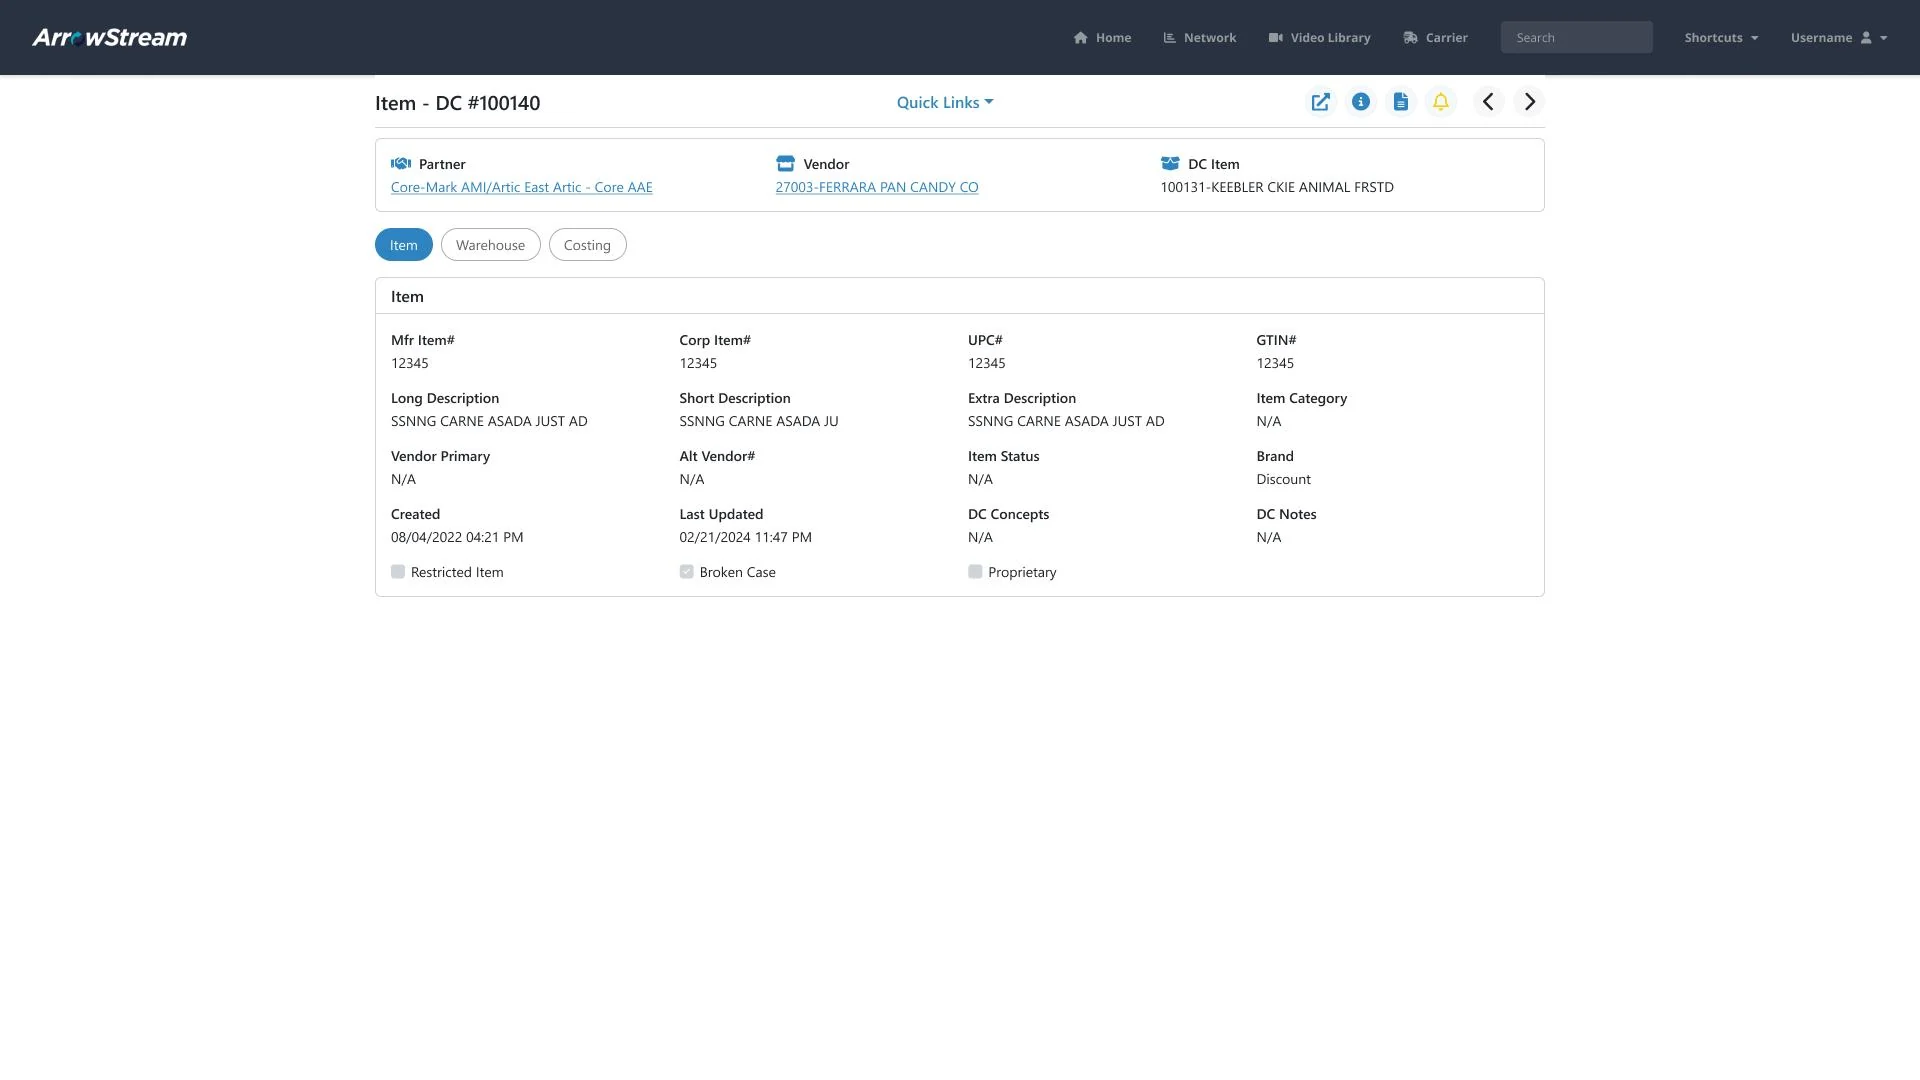
Arrowstream users analyse lanes, vendors, facilities and purchase orders across a whole distribution network. The data is dense (rates, margins, volumes, fill rates) and the screens had to answer “how is this lane doing?” without exporting to a spreadsheet.
- 01
Lane analysis
One view that keeps partner, vendor, facility and risk on the left, and turns fill rate, PO count and carrier estimates into glanceable cards on the right.
- 02
Trends over time
60-day and 6-month rows that compare products, cases, weight, cube, pallets and revenue side by side, with the average under every figure.
- 03
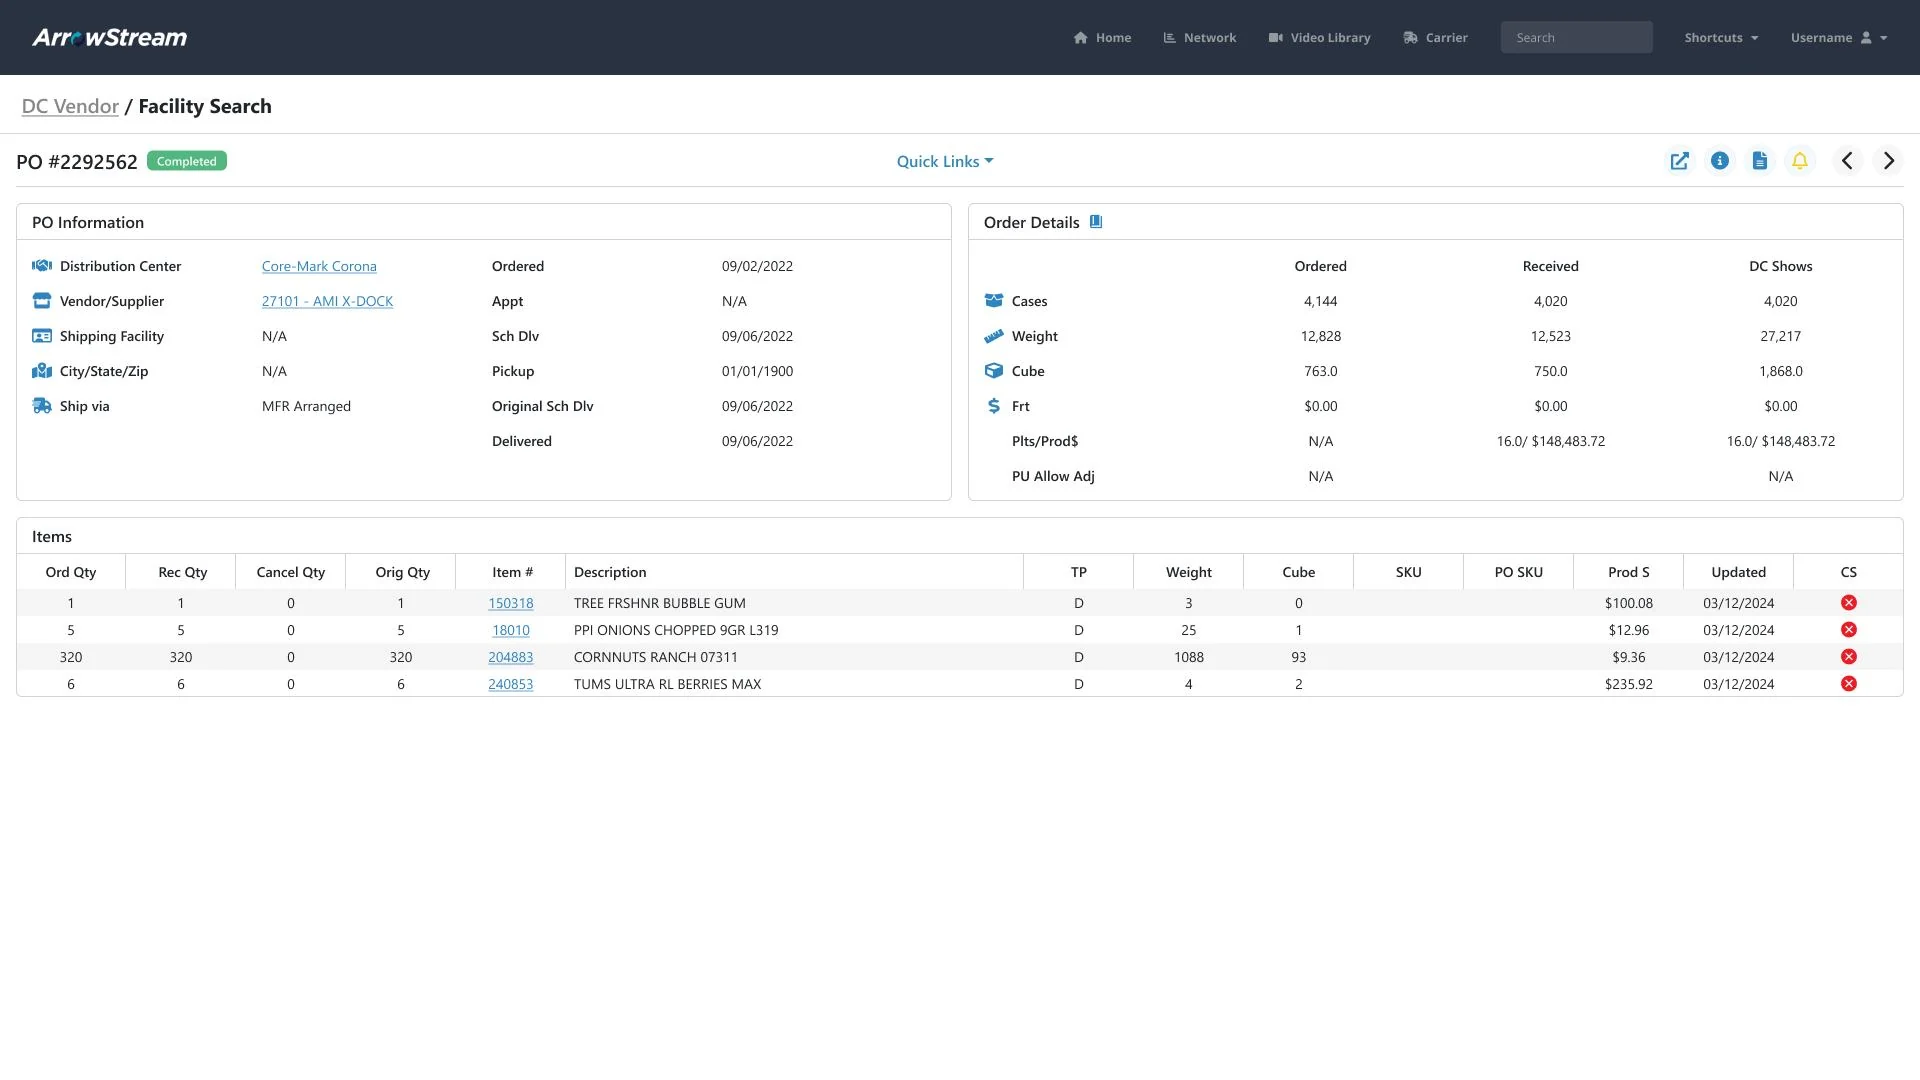
Purchase orders
PO detail screens with status and ordered-versus-received quantities, built from the same card system so every screen reads the same way.